Evaluation of Salt Spray Corrosion Test Results Using JIS Z 2371 Salt Spray Test Chamber
Evaluating salt spray corrosion test results demands precision, accuracy, and adherence to recognized standards. The JIS Z 2371 salt spray test chamber provides manufacturers with a reliable platform for assessing material durability under corrosive environments. Proper result evaluation transforms raw test data into actionable insights that inform material selection, coating development, and quality assurance protocols. LIB Industry manufactures advanced salt spray chambers engineered for comprehensive corrosion analysis, offering customizable solutions that meet diverse industrial testing requirements with exceptional precision and reliability.
Visual Inspection: Identifying Surface Damage and Corrosion Patterns
Visual inspection represents the foundational evaluation technique for salt spray corrosion testing. This method enables immediate assessment of surface degradation, providing qualitative insights into material performance before conducting more detailed analytical procedures.
Establishing Standardized Inspection Protocols
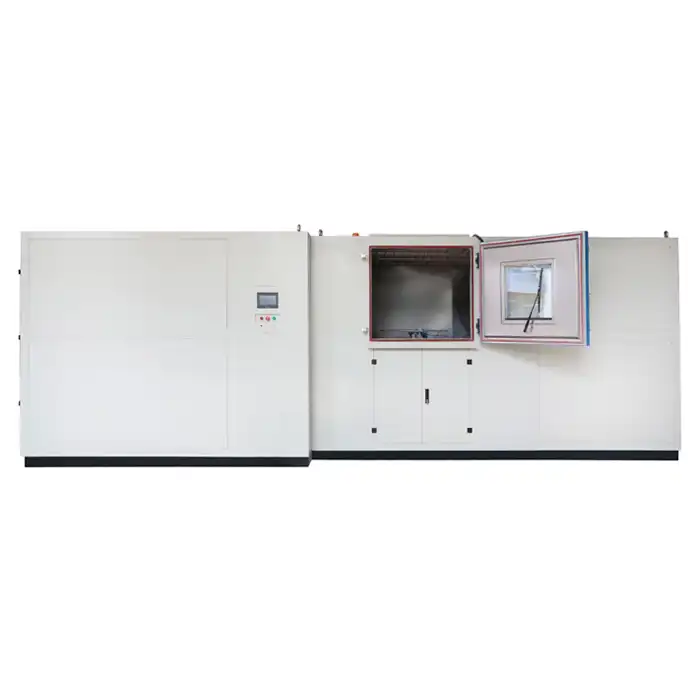
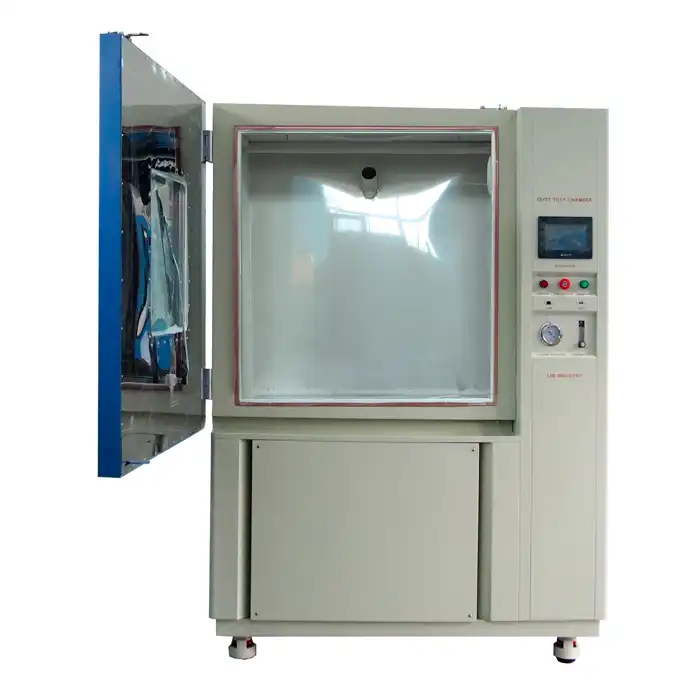
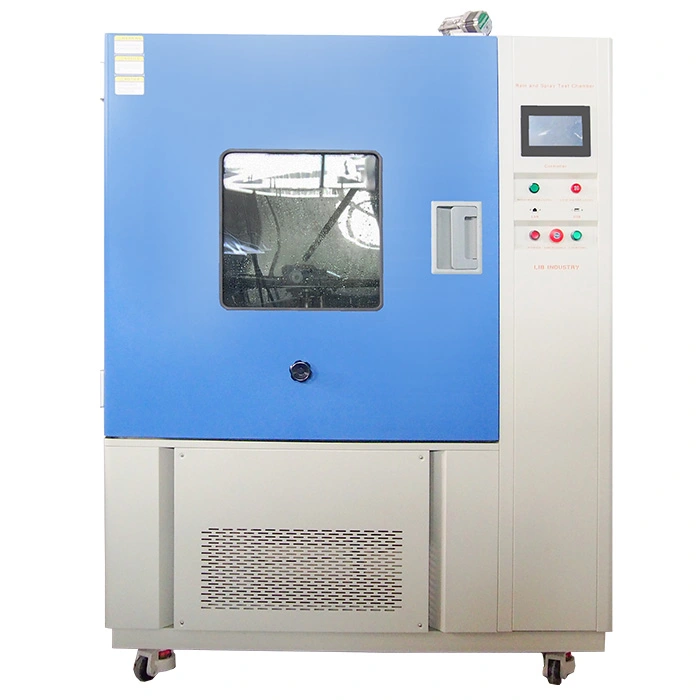
Effective visual evaluation begins with establishing consistent inspection protocols. Operators should examine specimens under controlled lighting conditions, preferably using daylight-equivalent illumination at 1000-1500 lux. LIB Industry's JIS Z 2371 salt spray test chamber features transparent observation windows that facilitate in-situ monitoring without disrupting test conditions. Documentation should include high-resolution photography from multiple angles, capturing both overall appearance and detail shots of specific degradation zones. Standardizing inspection timing - such as every 24, 48, 96, and 168 hours - creates comparable data sets across multiple test cycles.
Categorizing Corrosion Morphologies
Different materials exhibit distinct corrosion patterns that reveal underlying degradation mechanisms. Ferrous metals typically develop rust blooms progressing from isolated spots to continuous coverage. Aluminum alloys may show pitting corrosion characterized by localized penetration rather than uniform surface attack. Zinc coatings often display white rust formation before transitioning to red rust as the substrate becomes exposed. Recording these morphological differences helps correlate visual observations with mechanistic understanding, enabling predictive modeling of long-term performance in actual service environments.
Rating Systems and Comparative Analysis
International standards provide rating scales for quantifying visual corrosion severity. The most common approach divides surface area into percentage ranges: Rating 10 indicates no visible corrosion, while Rating 0 represents complete surface degradation. Intermediate ratings (9, 8, 7, etc.) correspond to progressive corrosion coverage percentages. Creating standardized rating templates ensures consistency across different evaluators and testing sessions. Comparative analysis against reference specimens or control samples provides context for interpreting results, particularly when evaluating new materials or modified coating formulations.
Weight Loss Method: Quantifying Corrosion Severity Through Mass Reduction
Mass loss measurement delivers quantitative corrosion data that complements visual assessment. This technique measures the actual material removed through corrosive attack, providing objective metrics for comparing material performance and validating coating effectiveness.
Specimen Preparation and Baseline Measurement
Accurate weight loss determination in a JIS Z 2371 salt spray test chamber requires meticulous specimen preparation. Test pieces must undergo thorough cleaning to remove manufacturing residues, oils, and contaminants that could skew initial mass measurements. The JIS Z 2371 standard recommends degreasing with appropriate solvents followed by drying in a controlled environment. Precision balances with 0.1 mg resolution ensure accurate baseline measurements. Recording initial dimensions alongside mass enables calculation of corrosion rates normalized to surface area, facilitating meaningful comparisons between specimens of different geometries.
Post-Test Cleaning Procedures
Removing corrosion products without attacking the underlying substrate represents the critical challenge in weight loss analysis. JIS Z 2371 specifies cleaning methods appropriate for different material types. Ferrous metals typically undergo chemical descaling using inhibited acid solutions (such as hydrochloric acid with hexamethylenetetramine inhibitor) that dissolve rust while minimizing base metal attack. Non-ferrous metals may require alkaline cleaning solutions or mechanical removal techniques. Multiple cleaning cycles with intermediate weighing help verify complete corrosion product removal without excessive substrate loss.
Calculating Corrosion Rates and Penetration Depth
Converting mass loss data into standardized corrosion metrics enables meaningful performance comparisons. The corrosion rate (CR) calculation follows this relationship:
Table 1: Corrosion Rate Calculation Parameters
|
Parameter |
Symbol |
Unit |
Description |
|
Mass Loss |
ΔM |
grams |
Difference between initial and final mass |
|
Surface Area |
A |
cm² |
Total exposed specimen area |
|
Exposure Time |
T |
hours |
Duration of salt spray exposure |
|
Material Density |
ρ |
g/cm³ |
Density of tested material |
|
Corrosion Rate |
CR |
mm/year |
Annualized penetration rate |
The formula CR = (87,600 × ΔM) / (A × T × ρ) converts weight loss into annualized penetration depth, expressed in millimeters per year. This standardized metric enables direct comparison between different test durations and specimen configurations. LIB Industry's testing chambers maintain precise environmental control that ensures reproducible mass loss measurements across multiple test cycles.
Morphological Analysis: Studying Corrosion Characteristics Under Microscope
Microscopic examination reveals corrosion mechanisms invisible to naked-eye inspection. This analytical approach provides insights into attack patterns, preferential corrosion sites, and coating-substrate interactions that inform material improvement strategies.
Optical Microscopy Techniques
Light microscopy offers accessible yet powerful analytical capabilities for corrosion evaluation. Cross-sectional preparation through mounting, grinding, and polishing exposes the corrosion profile beneath the surface. Metallographic examination reveals pit depth, intergranular attack, and coating delamination characteristics. Differential interference contrast (DIC) microscopy enhances surface topography visualization, highlighting corrosion product distribution and surface roughness changes. Magnifications ranging from 50× to 1000× capture features across multiple length scales, from macro-level coating failures to micro-level grain boundary attack.
Scanning Electron Microscopy for Detailed Characterization
Scanning electron microscopy (SEM) provides superior resolution and depth of field compared to optical techniques. SEM imaging at magnifications up to 100,000× reveals nanoscale corrosion features, including crystallographic orientation effects, localized coating defects, and corrosion product morphology. Energy-dispersive X-ray spectroscopy (EDS) coupled with SEM enables elemental mapping that identifies corrosion product composition and tracks elemental migration during degradation. These capabilities prove particularly valuable when evaluating complex coating systems tested in JIS Z 2371 salt spray test chambers, where multiple degradation mechanisms may operate simultaneously.
Profilometry and Surface Roughness Measurement
Quantifying surface topography changes provides objective metrics for corrosion severity assessment. Contact profilometry uses diamond stylus tracers to measure surface height variations with sub-micrometer resolution. Non-contact methods employing optical interferometry or confocal microscopy enable three-dimensional surface mapping without specimen damage. Parameters such as average roughness (Ra), maximum pit depth (Rmax), and surface area expansion ratio quantify degradation progression. Correlation between roughness parameters and exposure duration establishes predictive models for long-term performance estimation.
Electrochemical Measurements: Analyzing Corrosion Resistance with Electrochemical Techniques
Electrochemical testing methods provide real-time corrosion kinetics data that complements post-exposure analysis. These techniques measure corrosion rates during active degradation, enabling dynamic monitoring of protective coating breakdown and substrate attack progression.
Potentiodynamic Polarization Studies
Potentiodynamic polarization applies controlled potential sweeps while measuring current response, generating characteristic curves that reveal corrosion mechanisms. The Tafel extrapolation method determines corrosion current density (icorr) from linear polarization regions, directly correlating with instantaneous corrosion rate. Passive film formation, pitting potential thresholds, and repassivation behavior become apparent through polarization analysis. Comparing polarization curves before and after salt spray exposure quantifies degradation in corrosion resistance, validating accelerated test predictions against electrochemical measurements.
Electrochemical Impedance Spectroscopy Applications
Electrochemical impedance spectroscopy (EIS) applies alternating current signals across a frequency range, measuring the complex impedance response that characterizes coating barrier properties and interfacial reactions. Equivalent circuit modeling interprets impedance spectra, extracting parameters such as coating resistance, coating capacitance, and charge transfer resistance. Progressive EIS monitoring during salt spray testing tracks coating degradation mechanisms including water uptake, electrolyte penetration, and delamination initiation. LIB Industry's advanced chambers accommodate in-situ electrochemical sensors, enabling continuous impedance monitoring without test interruption.
Linear Polarization Resistance Monitoring
Linear polarization resistance (LPR) measurement provides rapid corrosion rate assessment through small-amplitude potential perturbations near the open circuit potential. The Stern-Geary equation converts polarization resistance into corrosion current density, assuming known Tafel constants. LPR's non-destructive nature permits repeated measurements on identical specimens throughout exposure, generating time-resolved corrosion kinetics data. Automated LPR systems integrated with salt spray chambers enable unattended monitoring of multiple specimens, creating comprehensive datasets that reveal temporal variations in corrosion behavior under controlled environmental conditions.
Table 2: Comparison of Electrochemical Measurement Techniques
|
Technique |
Time Required |
Information Obtained |
Destructive |
Best Application |
|
Potentiodynamic Polarization |
30-60 minutes |
Corrosion current, pitting potential, passivation behavior |
Yes |
Mechanistic studies, material ranking |
|
EIS |
20-120 minutes |
Coating resistance, capacitance, interfacial reactions |
No |
Coating evaluation, degradation tracking |
|
LPR |
2-5 minutes |
Instantaneous corrosion rate |
No |
Real-time monitoring, kinetics studies |
|
Open Circuit Potential |
Continuous |
Thermodynamic stability, coating breakdown |
No |
Long-term monitoring, failure prediction |
Coating Performance Evaluation: Assessing the Durability and Effectiveness of Protective Coatings
Protective coatings represent the primary defense against corrosion in many applications. Systematic coating evaluation using JIS Z 2371 salt spray test chambers provides manufacturers with critical data for formulation optimization and quality validation.
Adhesion Testing After Salt Spray Exposure
Coating adhesion often deteriorates before visible corrosion appears, making adhesion assessment essential for comprehensive performance evaluation. Cross-cut tape testing (per ASTM D3359) applies standardized lattice patterns through the coating to the substrate, followed by adhesive tape application and removal. Classification from 5B (no delamination) to 0B (greater than 65% removal) quantifies adhesion performance. Pull-off testing using hydraulic dollies measures quantitative adhesion strength in MPa. Comparing pre-exposure and post-exposure adhesion values reveals degradation mechanisms such as osmotic blistering, cathodic delamination, and interfacial weakening.
Blister Formation and Coating Integrity Assessment
Osmotic blistering results from water and ion accumulation beneath coatings, creating localized delamination without visible coating breach. ASTM D714 provides standardized blister rating procedures based on size (from 10-dense to 2-few large blisters) and frequency (Dense, Medium-Dense, Medium, or Few). Coating thickness measurements using magnetic or eddy-current gauges verify uniform application and identify thin spots prone to premature failure. Holiday detection using high-voltage spark testing locates microscopic coating discontinuities that accelerate substrate corrosion. These complementary techniques create comprehensive coating integrity profiles.
Accelerated Testing Correlation with Field Performance
Establishing correlation between accelerated salt spray testing and actual service exposure remains challenging yet essential for predictive modeling. Comparative exposure programs simultaneously test specimens in controlled chambers and outdoor atmospheric sites, generating correlation factors that translate laboratory hours into field years. Multi-factor accelerated testing incorporating cyclic temperature, humidity, and UV exposure alongside salt spray improves field correlation compared to continuous neutral salt spray alone. LIB Industry's customizable chamber configurations support complex cyclic protocols that better simulate real-world environmental variations, enhancing prediction accuracy for coating service life estimation.
FAQ
How long should salt spray testing continue for reliable coating evaluation?
Testing duration depends on coating type and intended service environment. Architectural coatings typically require 500-1000 hours, while automotive coatings may need 720-2160 hours. Marine-grade protective systems often undergo 3000+ hours of exposure. Periodic evaluation intervals reveal degradation kinetics rather than relying solely on endpoint assessment.
Can different materials be tested simultaneously in the same chamber?
Yes, the JIS Z 2371 salt spray test chamber accommodates multiple material types concurrently, provided they don't create galvanic couples or contaminate the test environment. Spatial separation prevents galvanic interaction, while material compatibility verification ensures test validity. LIB Industry's chambers feature adjustable sample holders accommodating diverse specimen geometries.
What factors most significantly affect test reproducibility and result accuracy?
Temperature stability, spray uniformity, salt solution concentration, and pH control represent critical variables. Chamber design features such as LIB Industry's saturated air barrel, precision temperature control (±0.5°C fluctuation), and automated solution management systems minimize variability. Regular chamber qualification using reference specimens validates ongoing performance and ensures data reliability.
Partner with LIB Industry for Your Salt Spray Testing Needs
LIB Industry delivers comprehensive corrosion testing solutions tailored to your specifications. As a leading JIS Z 2371 salt spray test chambers manufacturer and supplier, we provide turn-key installations including design, commissioning, training, and lifetime technical support. Our customization expertise ensures your chamber perfectly matches your testing requirements. Contact our specialists at ellen@lib-industry.com to discuss your corrosion testing challenges and discover optimized solutions.

.webp)
.webq.jpg)